

Two Taxes That Can Impact Investment Returns
Income tax is a direct tax imposed by governments on the financial income generated by all entities within their jurisdiction. Individuals, businesses, and corporations are obligated to pay this tax. Income tax rates are typically progressive, meaning the more one earns, the higher the tax rate. Income tax consists of:
- Ordinary income - This includes wages, salaries, commissions, and interest income. It is generally taxed at regular, progressive tax rates.
- Passive income - Income derived from rental activity, limited partnerships, or other enterprises in which the individual does not actively participate. It might be subject to net investment income taxes.
Capital gains tax is a tax levied on profits from the sale of an asset, such as stocks, bonds, or property. The tax applies when an asset is sold for more than it was bought for, with the difference constituting the "capital gain." This gain can be either short-term (held for one year or less) or long-term (held for more than one year), and each carries different tax implications.
- Short-term capital gains - Gains may be taxed at ordinary income tax rates.
- Long-term capital gains - Gains may be taxed at a lower rate, which can potentially encourage long-term investment. The tax rate typically depends on the investor's income.
Income Taxes - Income taxes can affect one's ability to save and invest. High income taxes may reduce disposable income, thereby reducing the funds available for investing. Investments are taxed at the investor's income tax rate, thereby reducing the investment's net return.
Capital Gains Tax - Capital gains tax can deter investors from selling profitable investments, prompting them to hold assets longer to qualify for a lower long-term capital gains tax rate. This holding-period strategy, known as 'tax-loss harvesting,' can potentially help reduce taxable income. However, tax-loss harvesting may not be appropriate for all investors, and its effectiveness depends on your individual tax bracket and investment portfolio.
Let's Team Up
The opinions voiced in this material are for general information only and are not intended to provide specific advice or recommendations for any individual.
The content is developed from sources believed to be providing accurate information. The information in this material is not intended as tax or legal advice. It may not be used for the purpose of avoiding any federal tax penalties. Please consult legal or tax professionals for specific information regarding your individual situation. This material was developed and produced by FMG Suite to provide information on a topic that may be of interest. FMG, LLC, is not affiliated with the named broker-dealer, state- or SEC-registered investment advisory firm. The opinions expressed and material provided are for general information and should not be considered a solicitation for the purchase or sale of any security.
This material was prepared by Fresh Finance for the Investment Service Center’s use.
Copyright FMG Suite.
The average U.S. headline tariff rate has moderated meaningfully from its April 2025 peak, as the authorities under which the administration has attempted to impose tariffs have continued to evolve. After briefly reaching 18%, the average headline tariff rate has fallen to roughly 10%, although it remains well above pre-2025 levels. Much of the decline reflects the Supreme Court’s ruling against the administration’s use of tariffs under the International Emergency Economic Powers Act (IEEPA), which led to the removal of many emergency tariffs. Looking ahead, however, new sector-specific tariffs under Section 232 are expected to offset part of this decline, leaving the average tariff rate elevated relative to history.
While the headline tariff rate captures announced policy, the realized burden on businesses has also eased. The effective tariff rate - which reflects actual duties paid as a share of goods imports - fell from a peak of approximately 12% late last year to around 7% in May, as the IEEPA tariffs were replaced by temporary tariffs at a lower rate under a different authority. At the same time, tariff refunds surged following the Supreme Court’s decision. The Treasury paid $49.2 billion in tariff refunds in June, roughly double new tariff collections for the month.
Preliminary analyses suggest that much of the tariff burden was absorbed by the companies themselves, rather than being passed onto consumers. Whether companies continue to absorb tariff costs will be important for corporate profits and inflation going forward. However, with a lower headline rate, neither threat is as significant as it was a year ago.
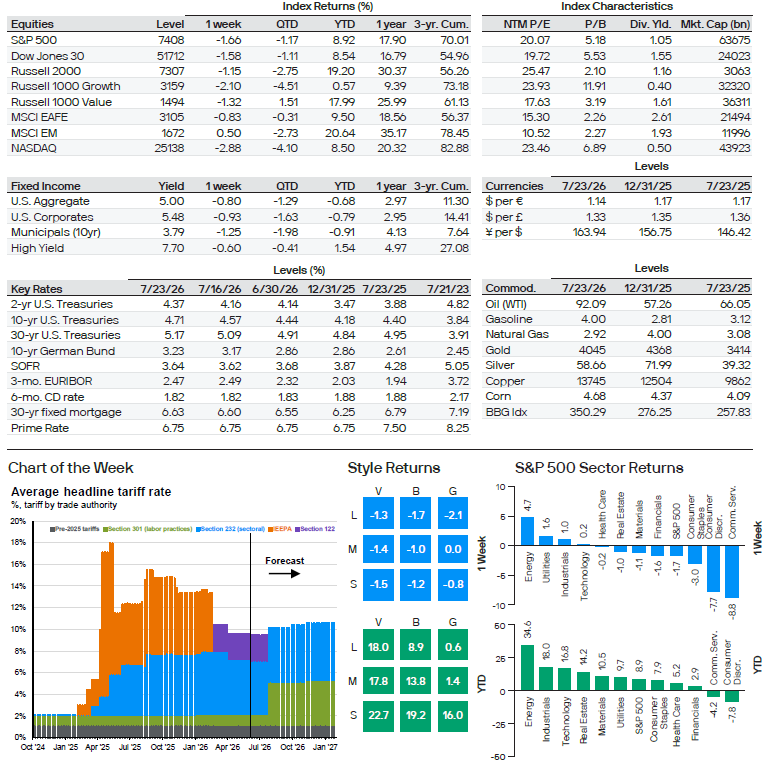
Chart of the Week: Source: Tax Policy Center, J.P. Morgan Asset Management.
Average statutory tariff rate of a policy (on a day) is the sum of tariff rates (on that day) on all import flows, imposed by that policy conditional on all other policies being in effect, weighted by import flows' 2025 import volumes. Estimates exclude AD/CVD. "Section 232 " is an aggregation of Section 232 automobile (and parts), truck (and parts), and bus tariffs, as well as Section 232 aluminum, steel, copper, wood, semiconductor, and pharmaceutical tariffs. IEEPA is the International Emergency Economic Powers Act. forecasts is by Tax Policy Center, a nonpartisan think tank which provides analysis on current and longer-term tax and policy issues.
Thought of the Week: Source: Federal Bank of St. Louis, U.S. Treasury Department, J.P. Morgan Asset Management.
Abbreviations: Cons. Sent.: University of Michigan Consumer Sentiment Index; CPI: Consumer Price Index; EIA: Energy Information Agency; FHFA HPI: - Federal Housing Finance Authority House Price Index; FOMC: Federal Open Market Committee; GDP: gross domestic product; HPI: Home Price Index; HMI: Housing Market Index; ISM Mfg. Index: Institute for Supply Management Manufacturing Index; PCE: Personal consumption expenditures; Philly Fed Survey: Philadelphia Fed Business Outlook Survey; PMI: Purchasing Managers' Manufacturing Index; PPI: Producer Price Index; SAAR: Seasonally Adjusted Annual Rate
Index: Institute for Supply Management Manufacturing Index; PCE: Personal consumption expenditures; Philly Fed Survey: Philadelphia Fed Business Outlook Survey; PMI: Purchasing Managers' Manufacturing Index; PPI: Producer Price Index; SAAR: Seasonally
Adjusted Annual Rate
MSCI EAFE is a Morgan Stanley Capital International Index that is designed to measure the performance of the developed stock markets of Europe, Australasia, and the Far East.
Bond Returns: All returns represent total return. Index: Bloomberg US Aggregate; provided by: Bloomberg Capital. Index: Bloomberg Investment Grade Credit; provided by: Bloomberg Capital. Index: Bloomberg Municipal Bond 10 Yr; provided by: Blomberg Capital. Index: Bloomberg Capital High Yield Index; provided by: Bloomberg Capital.
Key Interest Rates: 2 Year Treasury, FactSet; 10 Year Treasury, FactSet; 30 Year Treasury, FactSet; 10 Year German Bund, FactSet. 3 Month LIBOR, British Bankers’ Association; 3 Month EURIBOR, European Banking Federation; 6 Month CD, Federal Reserve; 30 Year Mortgage, Mortgage Bankers Association (MBA); Prime Rate: Federal Reserve.
Commodities: Gold, FactSet; Crude Oil (WTI), FactSet; Gasoline, FactSet; Natural Gas, FactSet; Silver, FactSet; Copper, FactSet; Corn, FactSet. Bloomberg Commodity Index (BBG Idx), Bloomberg Finance L.P.
information from FactSet's Pricing database as provided by MSCI. Russell 1000 Value Index,
Style Returns: Style box returns based on Russell Indexes with the exception of the Large-Cap Blend box, which reflects the S&P 500 Index. All values are cumulative total return for stated period including the reinvestment of dividends. The Index used from L to R,
top to bottom are: Russell 1000 Value Index (Measures the performance of those Russell 1000 companies with lower price-to book ratios and lower forecasted growth values), S&P 500 Index (Index represents the 500 Large Cap portion of the stock market, and
is comprised of 500 stocks as selected by the S&P Index Committee), Russell 1000 Growth Index (Measures the performance of those Russell 1000 companies with higher price-to-book ratios and higher forecasted growth values), Russell Mid Cap Value Index (Measures
the performance of those Russell Mid Cap companies with lower price-to-book ratios and lower forecasted growth values), Russell Mid Cap Index (The Russell Midcap Index includes the smallest 800 securities in the Russell 1000), Russell Mid Cap Growth Index (Measures the performance of those Russell Mid Cap companies with higher price-to-book ratios and higher forecasted growth values), Russell 2000 Value Index (Measures the performance of those Russell 2000 companies with lower price-to-book ratios and lower forecasted growth values), Russell 2000 Index (The Russell 2000 includes the smallest 2000 securities in the Russell 3000), Russell 2000 Growth Index (Measures the performance of those Russell
2000 companies with higher price-to-book ratios and higher forecasted growth values).
Past performance does not guarantee future results.
The J.P. Morgan Asset Management Market Insights and Portfolio Insights programs, as non-independent research, have not been prepared in accordance with legal requirements designed to promote the independence of investment research, nor are they subject to any prohibition on dealing ahead of the dissemination of investment research.
This document is a general communication being provided for informational purposes only. It is educational in nature and not designed to be taken as advice or a recommendation for any specific investment product, strategy, plan feature or other purpose in any
jurisdiction, nor is it a commitment from J.P. Morgan Asset Management or any of its subsidiaries to participate in any of the transactions mentioned herein. Any examples used are generic, hypothetical and for illustration purposes only. This material does not contain sufficient information to support an investment decision and it should not be relied upon by you in evaluating the merits of investing in any securities or products. In addition, users should make an independent assessment of the legal, regulatory, tax, credit, and accounting implications and determine, together with their own financial professional, if any investment mentioned herein is believed to be appropriate to their personal goals. Investors should ensure that they obtain all available relevant information before making any investment. Any forecasts, figures, opinions or investment techniques and strategies set out are for information purposes only, based on certain assumptions and current market conditions and are subject to change without prior notice. All information presented herein is considered to be accurate at the time of production, but no warranty of accuracy is given and no liability in respect of any error or omission is accepted. It should be noted that investment involves risks, the value of investments and the income from them may fluctuate in accordance with market conditions and taxation agreements and investors may not get back the full amount invested. Both past performance and yields are not reliable indicators of current and future results.
J.P. Morgan Asset Management is the brand for the asset management business of JPMorgan Chase & Co. and its affiliates worldwide.
Telephone calls and electronic communications may be monitored and/or recorded.
Personal data will be collected, stored and processed by J.P. Morgan Asset Management in accordance with our privacy policies at https://www.jpmorgan.com/privacy.
This communication is issued by the following entities:
In the United States, by J.P. Morgan Investment Management Inc. or J.P. Morgan Alternative Asset Management, Inc., both regulated by the Securities and Exchange Commission; in Latin America, for intended recipients’ use only, by local J.P. Morgan entities, as the case may be.; in Canada, for institutional clients’ use only, by JPMorgan Asset Management (Canada) Inc., which is a registered Portfolio Manager and Exempt Market Dealer in all Canadian provinces and territories except the Yukon and is also registered as an Investment Fund Manager in British Columbia, Ontario, Quebec and Newfoundland and Labrador.
If you are a person with a disability and need additional support in viewing the material, please call us at 1-800-343-1113 for assistance.
Copyright 2026 JPMorgan Chase & Co. All rights reserved.
©JPMorgan Chase & Co., July 2026.
Unless otherwise stated, all data is as of July 27, 2026 or as of most recently available.
0903c02a81dbac80
| Not Insured by FDIC or Any Other Government Agency | Not Bank Guaranteed | Not Bank Deposits or Obligations | May Lose Value |
|---|